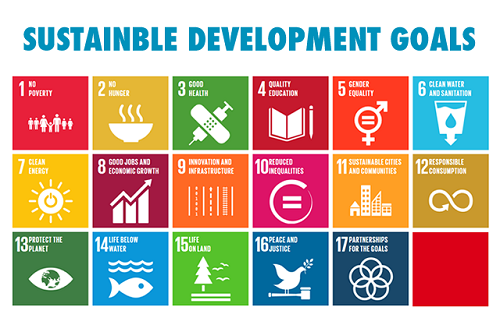
During the United Nations’ annual summit last week the 193 UN member-states endorsed the 2030 agenda for sustainable development, including 17 Sustainable Development Goals (SDGs) and 169 associated targets. The ambitious plan – set to commence in January 2016 - focuses on changes the world needs to tackle poverty and climate change, and leverage sustainable and equitable growth, now and in the future. Over the next 15 years governments, NGOs, companies and communities are expected to use these goals in developing policies, allocating finance and implementing measures and actions aimed at building a more inclusive, fair and sustainable world. The agenda fails to address, however, how implementation and performance towards these goals – including money flows - will be measured and monitored.
From goals to actions – allocating finance
Despite the third Financing for Development conference in Addis Ababa last July 2015, more thought could be given to the question of how achieving these goals will be financed. This question should not be understood from the perspective of where the money needs to come from, but from the perspective of where, how and what it needs to go to in order to achieve the most impact and contribute the most to achieving the SDGs. This implies underlying questions as: where does money currently flow to (and where does it not)? Where is it needed most? And – perhaps most importantly – which initiatives have the most impact and can be scaled or copied to other regions?
In order to answer these questions there is a need for reliable, consistent and easy-to-understand data. Insight into money flows, as well as the impact these flows establish, is crucial in order to achieve the SDGs.
Problems with data
Although the data currently available is unprecedented – particularly in comparison to the data available at the start of the Millennium Development Goals agenda in 2000 – there are still several hurdles:
- Data gaps
Data collection is not all encompassing, but depends on factors such as countries’ capacity to collect relevant data – often hindered by fragile political situations or population living in remote areas. That currently not every person in the world is being accounted for, is demonstrated in the number of people living in extreme poverty: the UN estimates this number to be 836 million, but this could just as well be 25% higher.
- Varying accuracy
The accuracy of collected data – in particular on financial flows and their impact – also depends on method of collections and resources available for this. Which money flows do you count and which not? Do you attribute impact to one flow or the other? This can be particularly challenging in low-income countries.
- Varying definitions
Different organisations use different definitions: if you look at the number of ‘low-income countries’ for example, the World Bank has 34, the IMF has 60, and the UN 48. Unfortunately, the same often goes for indicators used to measure impact and progress towards achieving the SDGs. This is problematic since if every country measures different indicators, how can be established which of these countries is closer to achieving targets and consequently where more efforts – and funds – are needed?
The potential of the data revolution
In spite of these hurdles, the so-called ‘data-revolution’, launched by Ban Ki-Moon in 2014, holds the promise of contributing significantly to achievement of the SDGs, simply because data holds the key to:
- Allocating funds more equally to facilitate more inclusive and fair growth and development – in line with the SDGs
- Creating more insight into what works and why, which is crucial in order to scale the right initiatives in the right contexts and thus further the contribution to achieving the SDGs
Standardizing indicators
The International Aid Transparency Initiative (IATI) has already been making important progress towards storing and reporting data in a unified format. Before there is data to store and report however, it is necessary to determine what you will be measuring and how. The starting point here would be to develop impact templates – blueprints if you will – with standardized indicators per target and SDG. Take for example the SDG ”empower all women and girls”, for which possible indicators could be the % of girls going to primary school, % of under-aged girls in forced marriages, etcetera. Using templates ensures all parties concerned measure the same things the same way.
Data collected with these templates can then be used to aggregate (add up) data for a certain region or certain target, thereby creating insight into the total progress of – for example – a certain country. Since all countries measure the same way, these templates can then also be used to compare different regions and targets, relate these to the money spent, and see where more efforts or funds are needed.
The business case of data regulation
To achieve the SDGs it is necessary that finance flows to those places where it is needed most, and is designated to those initiatives that can achieve the most impact. Insights from data are crucial to facilitate this. There is however a clear need to harmonize data, definitions, methodologies, methods of collection and sources for this to work properly and successfully implement the SDGs.
Over the next 15 years huge sums will be invested towards the SDGs. Designating a small part of this to better organize impact measurement and data collection will ensure better tracking of finance spent, as well as finance being spent better, i.e. with more impact and thus a bigger contribution towards achieving the SDGs.
Sinzer has been developing impact templates for a variety of organisations and sectors. Interested in learning more or discussing this topic?
Contact us to schedule a meeting, or go to our knowledge centre to browse our collection of (free) e-books and case studies.
-1.jpg?width=232&name=GT%20Sinzer_logo_screen_descriptor%20(1)-1.jpg)


